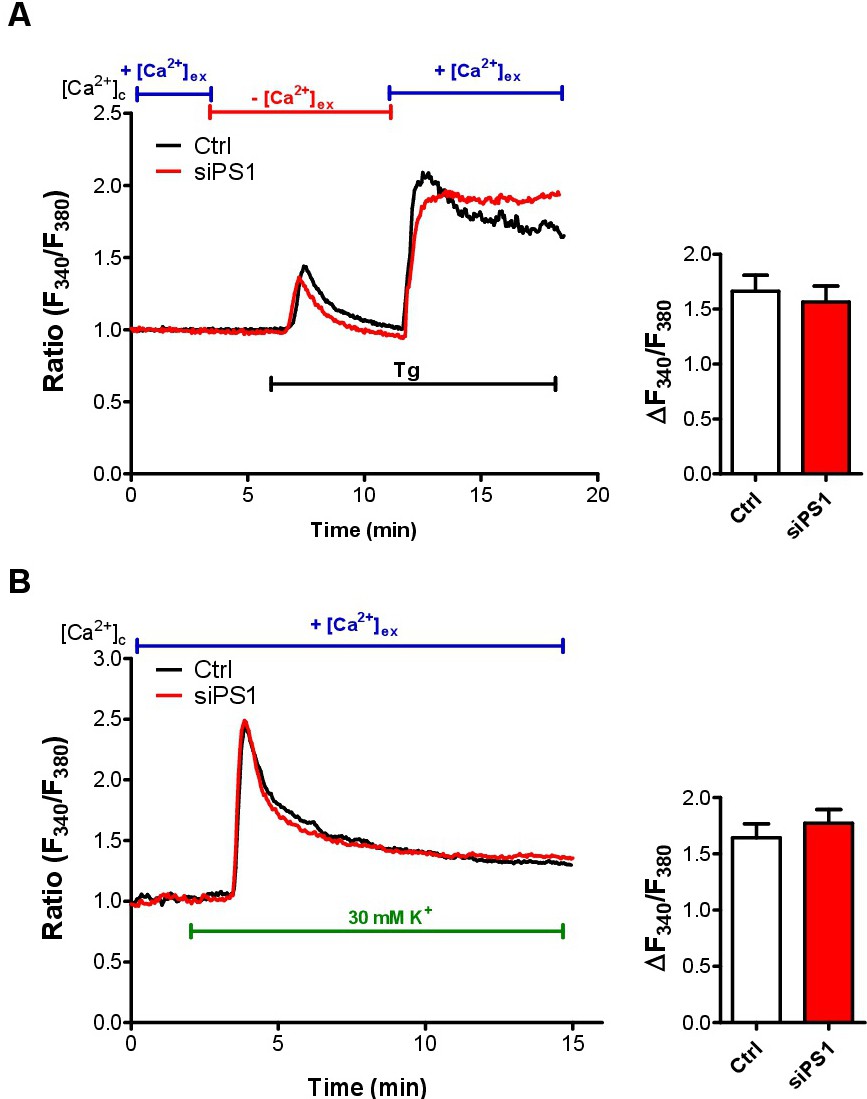
Fig. 2. Influence of presenilin-1 on plasma membrane Ca2+ uptake via L-type Ca2+ channels. Representative curves (left panels) and respective statistics (right panels) of cytosolic Ca2+ measurements in INS-1 cells transfected with either control siRNA or siRNA against presenilin-1. Cells were loaded with the cytosolic Ca2+ indicator Fura-2/AM and perfused and imaged on the microscope under different conditions. (A) INS-1 cells were perfused with Ca2+-containing buffer (+[Ca2+]ex) until the baseline was stable before switching to Ca2+-free EGTA-containing buffer (-[Ca2+]ex) as indicated in the graphs. 1 µM of the SERCA inhibitor thapsigargin (Tg) was applied under Ca2+-free conditions leading to an increase in cytosolic Ca2+. Afterwards, extracellular Ca2+ was re-added under the presence of Tg. Bars on the right represent the cytosolic Ca2+ increase after Ca2+ re-addition, mean ± SEM (Control: n=275/9; siPS-1: n=277/9). (B) INS-1 cells were perfused with Ca2+-containing buffer (+[Ca2+]ex) and depolarized with 30 mM K+-containing buffer. Bars on the right represent the cytosolic Ca2+ increase after depolarization with 30 mM K+, mean ± SEM (Control: n=273/9; siPS-1: n=281/9).